АвтоАвтоматизацияАрхитектураАстрономияАудитБиологияБухгалтерияВоенное делоГенетикаГеографияГеологияГосударствоДомДругоеЖурналистика и СМИИзобретательствоИностранные языкиИнформатикаИскусствоИсторияКомпьютерыКулинарияКультураЛексикологияЛитератураЛогикаМаркетингМатематикаМашиностроениеМедицинаМенеджментМеталлы и СваркаМеханикаМузыкаНаселениеОбразованиеОхрана безопасности жизниОхрана ТрудаПедагогикаПолитикаПравоПриборостроениеПрограммированиеПроизводствоПромышленностьПсихологияРадиоРегилияСвязьСоциологияСпортСтандартизацияСтроительствоТехнологииТорговляТуризмФизикаФизиологияФилософияФинансыХимияХозяйствоЦеннообразованиеЧерчениеЭкологияЭконометрикаЭкономикаЭлектроникаЮриспунденкция
The electrocardiogram
|
Читайте также: |
 Coverage by excitation of huge quantity of cells of the worker myocardium causes occurrence of a negative charge on a surface of these cells. Heart becomes the powerful electrogenerator. Tissues of a body, possessing rather high electroconductivity, allow registering electric potentials of heart from surface of bodies. Such technique of research of electric activity of the heart, is entered into practice by V. Enthoven, A.F. Samoilov, T. Lewis, V.F. Zelenin, is called electrocardiography, and the curve registered with its help is called the electrocardiogram. Electrocardiography is wide applied in medicine as the diagnostic method, allowing to estimate dynamics of distribution of excitation in heart and to judge infringements of cardiac activity at changes of an electrocardiogram.
Now special device - electrocardiograph is used. Record of curves is made on a moving paper tape.
Fig. 3. Imposing of electrodes at standard assignments of the electrocardiogram (I-III) and forms of the electrocardiograms received at these assignments.
Owing to the certain position of heart in a thorax and the original form of a body of the person the electric power lines arising between raised (-) and not raised (+) sites of heart, are distributed on a surface of a body irregularly. For this reason depending upon a place of the location of electrodes the form of an electrocardiogram and amplitude of it peaks will be various. For registration of an electrocardiogram it is necessary to make tap of potentials from extremities and surfaces of a thorax.
Usually use three so-called standard taps from extremities: I tap: the right hand - the left hand; II tap: the right hand - the left leg; III tap: the left hand - the left leg (fig. 3). Three unipolar strengthened Goldberg’s taps on are registered: aVR; aVL; aVF. At registration of the strengthened tap two electrodes used for registration of standard taps, are united in one and the potential difference between the incorporated and active electrodes is registered. So, at aVR the electrode imposed on the right hand is active, at aVL - on the left hand, at aVF - on the left leg. Wilson offers registration of six thorax taps.
The mutual relation of size of peaks in three standard taps has been established by Enthoven. He has found, that electromotive force of heart registered in II standard tap, is equal to the sum of electromotive forces in I and III taps. Expression of electromotive power is the height of peaks, therefore peaks of II tap on the size are equal to the algebraic sum of peaks of I and III taps.
For tap of potentials from a thorax it is necessary to put the first electrode to one of six points shown on figure 4.
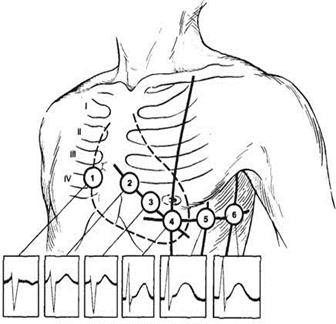 Fig. 4. Places of imposing of electrodes at thorax taps of the electrocardiogram (1-6) and forms of the electrocardiograms received at these taps. I-IV- intercostal intervals.
As the second electrode three electrodes connected together, imposed on both hands and the left leg serve. In this case the form of an electrocardiogram reflects electric changes only in a site of the part of the thorax electrode. The incorporated electrode, appurtenant to three extremities, is indifferent, or «zero» as its potential does not change during all cardiac cycle. Such taps are called unipolar, or unidirectional. These taps are designated by Latin letter V (V1, V2).
The normal electrocardiogram of the person received in II standard tap, is shown on fig. 5. At the analysis of electrocardiogram amplitude of peaks in mV is defined, time of their course in seconds, duration of segments - sites of isopotential lines between next peaks.
Formation of an electrocardiogram (it peaks and intervals) is caused by distribution of excitation in heart and displays this process. Peaks arise and develop, when between sites of excitable systems there is a potential difference. Any part of system is captured by excitation, and another is not captured by excitation. Isopotential line arises when within the limits of excitable systems are not present a potential difference. All system is not raised or, on the contrary, is captured by excitation. The registered electrocardiogram reflects consecutive coverage by excitation retractive myocardium of auricles and ventricle.
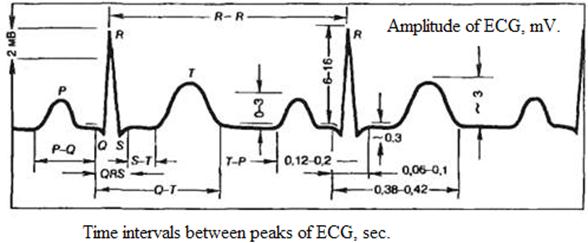
Fig. 5.
Peak Р (see fig. 5) displays coverage by excitation of auricles and is called atrial. Further excitation distributes on sinoatrial node also moves on conductive system of ventricle. At this time electrocardiograph registers isopotential line (both auricles are completely raised, both ventricles are not raised yet, and movement of excitation on conductive system of ventricles is not register by electro-cardiograph - segment PQ on an electro-cardiogram). In auricles excitation extends mainly on retractive myocardium avalanchely.
Coverage by excitation of ventricles is carried out by means of transfer of excitation from elements of conductive systems on retractive myocardium that causes complex character of complex QRS reflecting coverage by excitation of ventricles. Thus peak Q is caused by excitation of a top of heart, and internal surface of ventricles, peak R - excitation of the basis of heart and an external surface of ventricles. Process of full coverage by excitation of myocardium of ventricles will complete to the end of formation of peak S. Now both ventricles are raised, and segment ST is on isopotential line, owing to absence of a potential difference in excitable system of ventricles.
Peak Т reflects processes of repolarization, or restoration of normal membrane potential of cells of a myocardium. These processes in various cells arise not strictly synchronously. Therefore there is a potential difference between even depolarize sites of a myocardium (possessing negative charge) and the sites of the myocardium which as restored the positive charge. The specified potential difference is registered in the form of peak T. This peak is the most changeable part of an electrocardiogram. Between peak Т and the subsequent peak Р the isopotential line is registered, because in this time in a myocardium of ventricles and in a myocardium of auricles there is no potential difference. Visible reflection of peak, corresponding repolarization of auricle, is not present on an electrocardiogram, because it coincides with powerful complex QRS on time.
The general duration of an electric systole of ventricles (Q-T) almost coincides with duration of a mechanical systole (the mechanical systole begins a little bit later, than electric).
The electrocardiogram allows estimating character of violation of carrying out of excitation in heart. So, on size of interval Р-Q (from the beginning peak Р and to the beginning peak Q) it is possible to judge about, whether carrying out of excitation from an auricle to ventricle with normal speed is made. This time is equal to 0,12-0,2 sec in norm. The general duration of complex QRS reflects speed of coverage by excitation of conductive myocardium of ventricles and is equal to 0,06-0,1 (see fig. 5).
Processes of depolarization and repolarization arise in different sites of a myocardium non-simultaneously, therefore the size of a potential difference between various sites of a cardiac muscle during a cardiac cycle changes. A conditional line, connected two points, possessing the greatest potential difference, in each moment is called electric axis heart. During each given moment an electric axis of heart characterized by in the certain size and a direction, possesses properties of vector size. Owing to non-simultaneity of coverage by excitation of various departments of a myocardium this vector changes the direction. Simultaneous record of changes of size of a potential difference and a direction of an electric axis is called vectorcardiogram (VCG).
Поиск по сайту: